“You can’t manage what you can’t measure.”
Peter Drucker
Many factors come into play in the success or failure of your Amazon.com store. Revenue and Profitability are obviously important as that is presumably why you even have an Amazon.com store in the first place. What if however you could see into the future and know in advance when a problem was going to occur? Maybe a cash flow crunch or inventory problems or a drop in sales. Sadly of course there is no crystal ball and no perfect way to see the future. This article will discuss the next best thing; tracking the key metrics that will inform you of trouble brewing. Hopefully this will allow you to take action before sales or profits drop.
First a caveat. Are these the only metrics you should track? Absolutely not and in fact some may argue that other metrics are more important. Operational metrics should certainly be tracked to make sure you are not going to get on Amazon’s nasty list with a high Order Defect Rate or other poor performance based metrics. I will be posting a detailed run down of those metrics at a later date.
Five Key Metrics To Monitor the Sales Health of Your Amazon Store
The five metrics we will explore in this series of blog articles are: Conversion Rate %, Buy Box %, Pay Per Click Advertising Cost of Sales (PPC ACoS), Top Keywords, and Best Seller Ranking. Consider these of equal importance. These should be calculated and tracked on a monthly basis at a minimum. If you have a highly season product and during the slow period in seasonal businesses monthly is acceptable but during peak time and preferably year round, weekly is better. Okay now let’s get to the metrics.
Metric Number 1 – Conversion Rate %
The number one metric in eCommerce is conversions. Are you converting customers by their decision to make a purchase on your site? On the Amazon marketplace, conversions are one leg of the three legged stool of ranking your listings with the other two legs being sales history and sales velocity. Most agree that a conversion percentage below about 7% should be addressed.
Amazon uses a slightly different term for conversions called Session Percentage. The calculation for session percentage is Number of Sessions / Total Orders. To clarify, don’t worry about total pages views or total units ordered when considering your Conversion rate.
Here is the report Amazon provides for this metric. You can download this data to excel for processing:
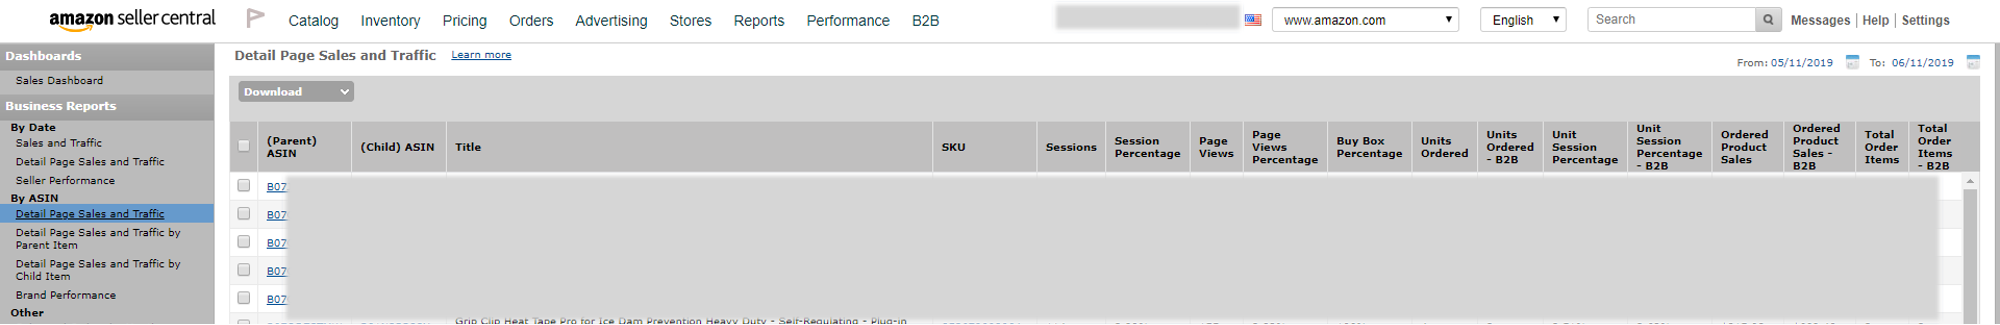
Pulling this data into a weekly report and using some Excel magic to graph the trend over time is helpful for keeping an accurate pulse on your conversion rate.
What to Do if Conversion rate is dropping?
If conversion is dropping, shoppers are coming to your listing but deciding for some reason not to make a purchase. Are there negative reviews hurting your listing? Do you have nice high quality images? You will need to look into the specifics and solve those issues with the product or with your listing. Often times, improved photos or improved copy that addresses questions or concerns can improve your listing dramatically and conversion rate will improve.
Take a look at your competitor’s listings. Perform searches with your main keywords and also look at what sponsored products are showing on your listing.
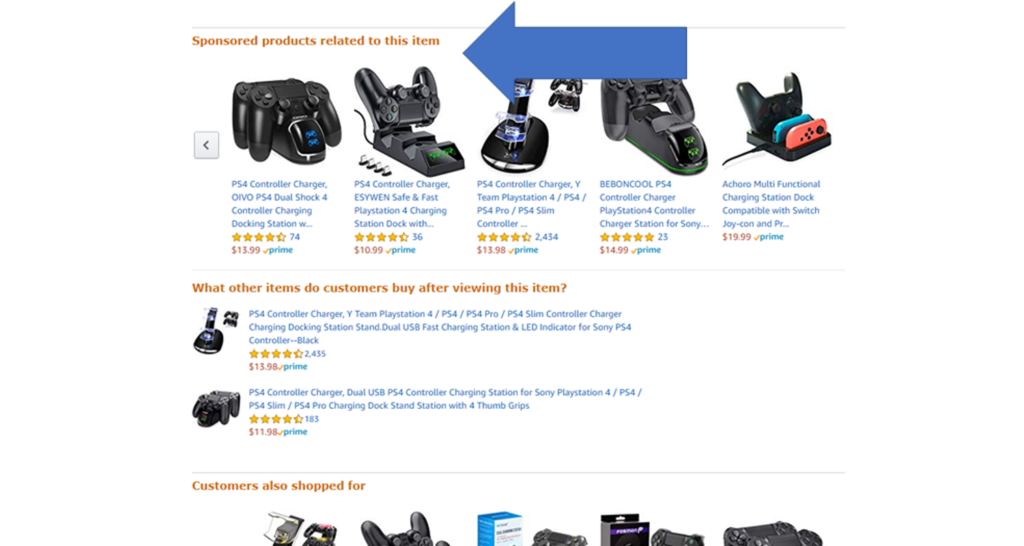
Look at the competitor’s listings and determine how they are beating you. Is there product superior? Do they have a high quality listing? Do you need to lower your price to become more competitive? I recommend you lower your price only as a last resort. Do not encourage a race to the bottom until your product lifecycle dictates that the end is near.
Consider hiring a freelance photographer to improve your photos. Be sure to include more lifestyle images to invoke a feeling with the potential buyer. You want them to be able to picture themselves experiencing your awesome product. Hire a freelance copywriter to breathe new life into your title, description and bullet points.
In the next post we dive into the Buy Box % metric.